The Q3 2026 benchmarks of market authority. 294 completed brand assessments across 28 recorded sector categories, with a high percentage from Sweden.
Structural foundations continue to outperform external authority. Across the Q3 portfolio, average Structural Confidence is 76.2, compared with Human Authority of 65.8. The 10.4-point gap suggests that many businesses have stronger organisational foundations than the authority signals buyers can readily see.
Proof and Validation remains the weakest Human Authority pillar, averaging 12.8 out of 25, or 51.0% of the available score. Strategic Positioning averages 19.5, Trust Infrastructure 17.5 and Market Presence 15.9.
203 of 294 completed brand assessments reach the Market Authority Index certification threshold of 65 or above, representing 69.0% of the portfolio up from 57% in Q2 but that is due to more known brands and sectors being added than a general increase.
Consumer-facing businesses average Market Authority Index of 72.0, compared with 61.2 for business-facing businesses. The 10.8-point difference is accompanied by a much larger Human Authority gap, 14.0 points, than the Structural Confidence gap of 3.1 points. This is an observed cohort difference, not evidence that a consumer business model causes higher authority but from earlier analysis they put more effort into building visible authority than B2B businesses.
63 brands reach Gold status at 80 or above, representing 21.4% of the portfolio and appearing across 10 recorded sector categories, the same number as in Q2.
219 of 294 completed brand assessments, 74.5% (80% in Q2), score higher on Structural Confidence than Human Authority.
The Q3 portfolio has expanded substantially since Q2. Differences between the editions reflect changes in sector mix, assessment scope and cohort composition as well as the scores recorded. They should not be read as like-for-like improvement.
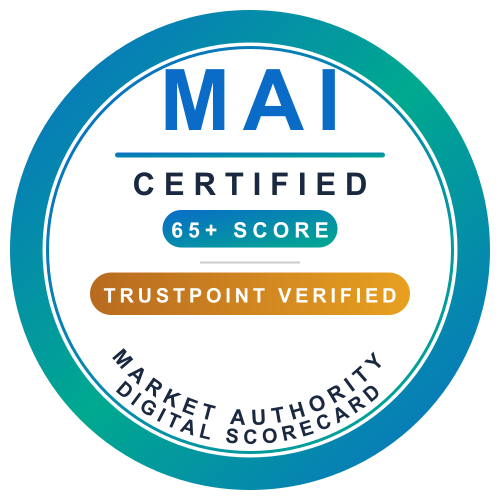
Market Authority Index of 65 - 69.
Meets the Market Authority Index certification threshold. Demonstrable authority with defined areas for growth. 47 brands.
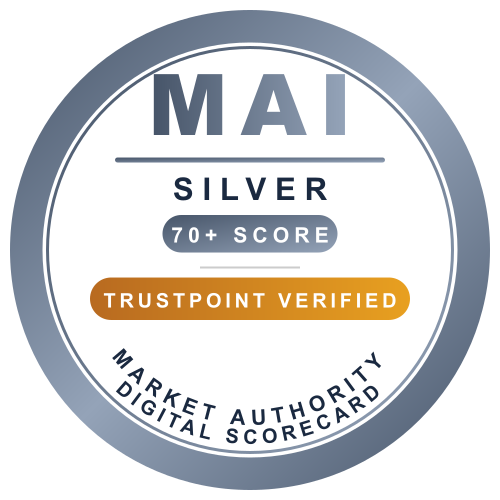
Market Authority Index of 70 - 79.
Strong market authority. Well established with clear competitive positioning. 93 brands.
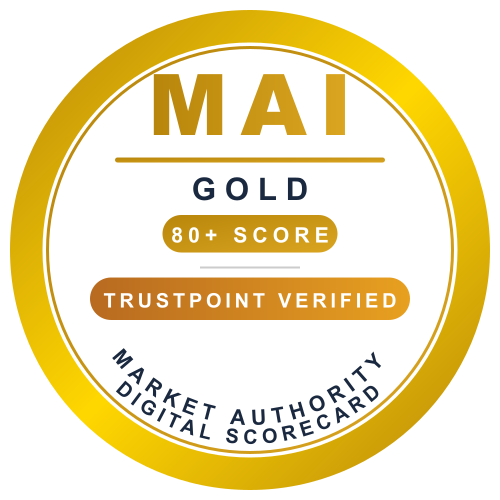
Market Authority Index of 80 and above
Exceptional market authority. Consistent across all dimensions of trust, positioning, and proof. 63 brands.
The chart maps the 203 assessments that meet the certification threshold of 65 or above. Each point represents one assessed business or line of business. The horizontal axis shows Human Authority; the vertical axis shows Structural Confidence. Colour identifies the sector category.
The reference lines show the full-portfolio benchmarks: 65.8 for Human Authority and 76.2 for Structural Confidence. Points in the upper-right quadrant exceed both averages. Hover over a point to see its name, assessed scope, sector and Market Authority Index score.
Each bubble is a brand. Bubble size reflects company scale: micro, small, or medium. Colour reflects sector. The two reference lines divide the chart into quadrants. Top-right is where you want to be — high perception and high structural credibility. Most brands are not there yet. Hover over any bubble to see the brand, its Market Authority Index and its size tier. Click on the legend to remove/add sectors.
Home, Interior & Lifestyle forms the largest certified cluster, with 69 certified brands. Its certified brands average 71.0 in Human Authority and 81.1 in Structural Confidence.
Certified Supplements brands average 78.6 in Human Authority, while certified Financial Services & Fintech brands average 79.4 in Human Authority and 90.3 in Structural Confidence. These are distinct authority profiles rather than a single route to a strong score.
Industrial & Manufacturing has nine certified brands, averaging 64.1 in Human Authority and 86.8 in Structural Confidence. This 22.7-point gap illustrates how substantial structural credibility can coexist with weaker external authority signals.
Certification identifies brands meeting the threshold; it does not mean every point is a sector leader or a top-three business.
A standout data point: Smaller size businesses can and do standout. One of the best cases as noted in Q2 is that of Treehotel, a micro-sized hospitality brand with fewer than 10 employees, scores a Human Authority of 84 — higher than most small and medium brands across all sectors. Brand equity, built carefully over time, can significantly outpace company size.
Average Market Authority Index, Human Authority and Structural Confidence scores are shown for the 15 sector categories with at least three assessed brands, covering 276 of the 294 completed brand assessments. The portfolio contains 28 recorded sector categories in total; smaller categories are not included in the main comparison chart.
All scores come from completed assessments. Estimated and expected competitor scores are excluded. A three-brand minimum is a reporting convention, not a guarantee of statistical reliability or representativeness. Read each sector average alongside its sample size.
Financial Services & Fintech and Supplements have the highest average Market Authority Index scores among categories meeting the three-brand threshold, at 82.6 and 77.2 respectively.
Home, Interior & Lifestyle is the largest category, with 82 assessments and an average of 71.4. It accounts for 27.9% of the portfolio, so its representation materially affects the overall average. But is must be noted that when establishing the benchmark for these and most sectors we tend to assess the businesses we know and therefore are more likely to be leading. So these benchmarks are more like leading indicators for those that want to be leading in their sector with market authority.
Industrial & Manufacturing shows a particularly wide structural-to-human gap: 83.8 for Structural Confidence versus 54.2 for Human Authority. This is a useful starting point for investigating authority-building opportunities, not proof that all industrial businesses share the same weaknesses.
Market Authority combines two complementary questions: how strongly buyers trust and believe in the business, and how much confidence its organisational foundations provide.
Across the Q3 portfolio, the average Market Authority Index is 69.0, combining Human Authority of 65.8 and Structural Confidence of 76.2.
An independent assessment of a business’s market authority, combining Human Authority and Structural Confidence. The assessment weights Human Authority at 70% and Structural Confidence at 30%, with applicable assessment caps and rounding.
How strongly your brand commands trust and authority in your market.
How strongly buyers trust and believe in your brand.
How strongly your business structure signals credibility and reduces buyer risk.
How strongly buyers trust and believe in the business. It combines Strategic Positioning, Proof and Validation, Trust Infrastructure and Market Presence. Signals include differentiation, reviews and customer evidence, external recognition, transparency, useful content, search visibility and digital presentation.
How strongly the business's organisational foundations support credibility and reduce buyer risk. It assesses Filing Compliance, Financial Risk Signals, Governance Stability and Operational Longevity.
Market authority varies across the assessed business models and routes to market. The tables distinguish whom a business serves from how it sells or delivers its offering.
Consumer-facing businesses average MAI is 72.0, business-facing businesses 61.2, and mixed business/consumer models 71.0. The consumer-facing advantage is associated primarily with stronger Human Authority in this portfolio, not a comparable difference in structural foundations.
Physical/e-commerce hybrid categories have the highest averages among the commerce groups shown: 76.0 for Physical + E-commerce and 75.2 for E-commerce + Physical. Pure E-commerce averages 71.3. Professional Service averages 61.5, with Human Authority of 56.3 compared with Structural Confidence of 73.3.
These are descriptive comparisons. Category definitions, sector mix, sample sizes and business scope all matter; the figures do not establish that adopting a particular channel will cause a higher score.
203 assessed brands in the Q3 portfolio meet the certification threshold of 65 or above. This includes 47 Certified, 93 Silver and 63 Gold brands. Each qualifying score comes from a completed assessment, not an estimated competitor score.
View the Market Authority Index directory to explore listed businesses and their assessment profiles.
Most businesses want to know how they compare in their own market. Each sector page shows the Q3 2026 scores of the brands assessed in that market, the four Human Authority pillars set against all sectors, and what the pattern suggests. Six sector pages are available now; more are added as they are ready.
27 assessed brands · 15 Sweden · 12 Ireland · Q3 2026
Where authority is strongest, where proof is thinner, and the score behind each brand, with a Sweden and Ireland filter.
28 assessed brands · Q3 2026
The lowest sector average of the six, and the scores behind it.
24 assessed brands · Q3 2026
How distilleries and visitor centres in Ireland, Sweden and the UK compare, with six Gold-level brands.
22 assessed brands · Q3 2026
A sector level with the all-sector average, and where its pillars differ.
18 assessed brands · Q3 2026
How fashion and apparel brands compare, with six Gold-level brands.
17 assessed brands · Q3 2026
Structural strength well ahead of buyer-facing authority.
28 assessed brands · Q3 2026
How supplement, wellbeing, pharmacy and digital health brands compare across the UK, US, Sweden and Denmark, with 15 Gold-level brands.
22 assessed brands · Q3 2026
How home and furniture retailers in Ireland and Sweden compare, with seven Gold-level brands.
14 assessed brands · Q3 2026
How window, door and installation brands in Sweden compare, with nine certified brands.
Q3 sector pages: Fitted Kitchens · Professional & Business Services · Distilleries & Visitor Centres · Pet Supplies & Animal Health · Fashion, Apparel & Personal Style · Industrial & Manufacturing · Health, Wellness & Pharmacy · Home Retail · Windows, Doors & Installation. Each lists only certified brands, those with a Market Authority Index of 65 or above. More sector pages will be added as each one is published. Looking for last quarter? See the Q2 2026 benchmarks and sector reports.
A PDF summary of the key findings, sector patterns, and what they mean for SMEs competing for buyer attention. No form, no gate — just the report.
Take the free Market Authority Index (MAI) assessment to benchmark your Market Authority and identify your biggest opportunities for improvement. Start your assessment here.
These benchmarks use completed assessments dated on or before 30 September 2026. The sample record and superseded duplicate assessments are excluded. Distinct business lines are retained as separate assessments. Overall statistics use 294 completed brand assessments; Human Authority pillar averages use 285 complete, reconciled profiles. Sector and subsector labels follow the Digital Scorecard Sector Framework as at 17 November 2026. Sector comparisons retain the recorded categories and require at least three assessed brands for the main chart. The portfolio is not a random or representative market sample but tends to measure the leaders or known brands in any sector. Quarterly averages are affected by the businesses, sectors and scopes included. Market Authority Index scores are independent of purchased services.